Images in this archived article have been removed.
(Updated June 2015 with 2014 data)
By Steve Andrews
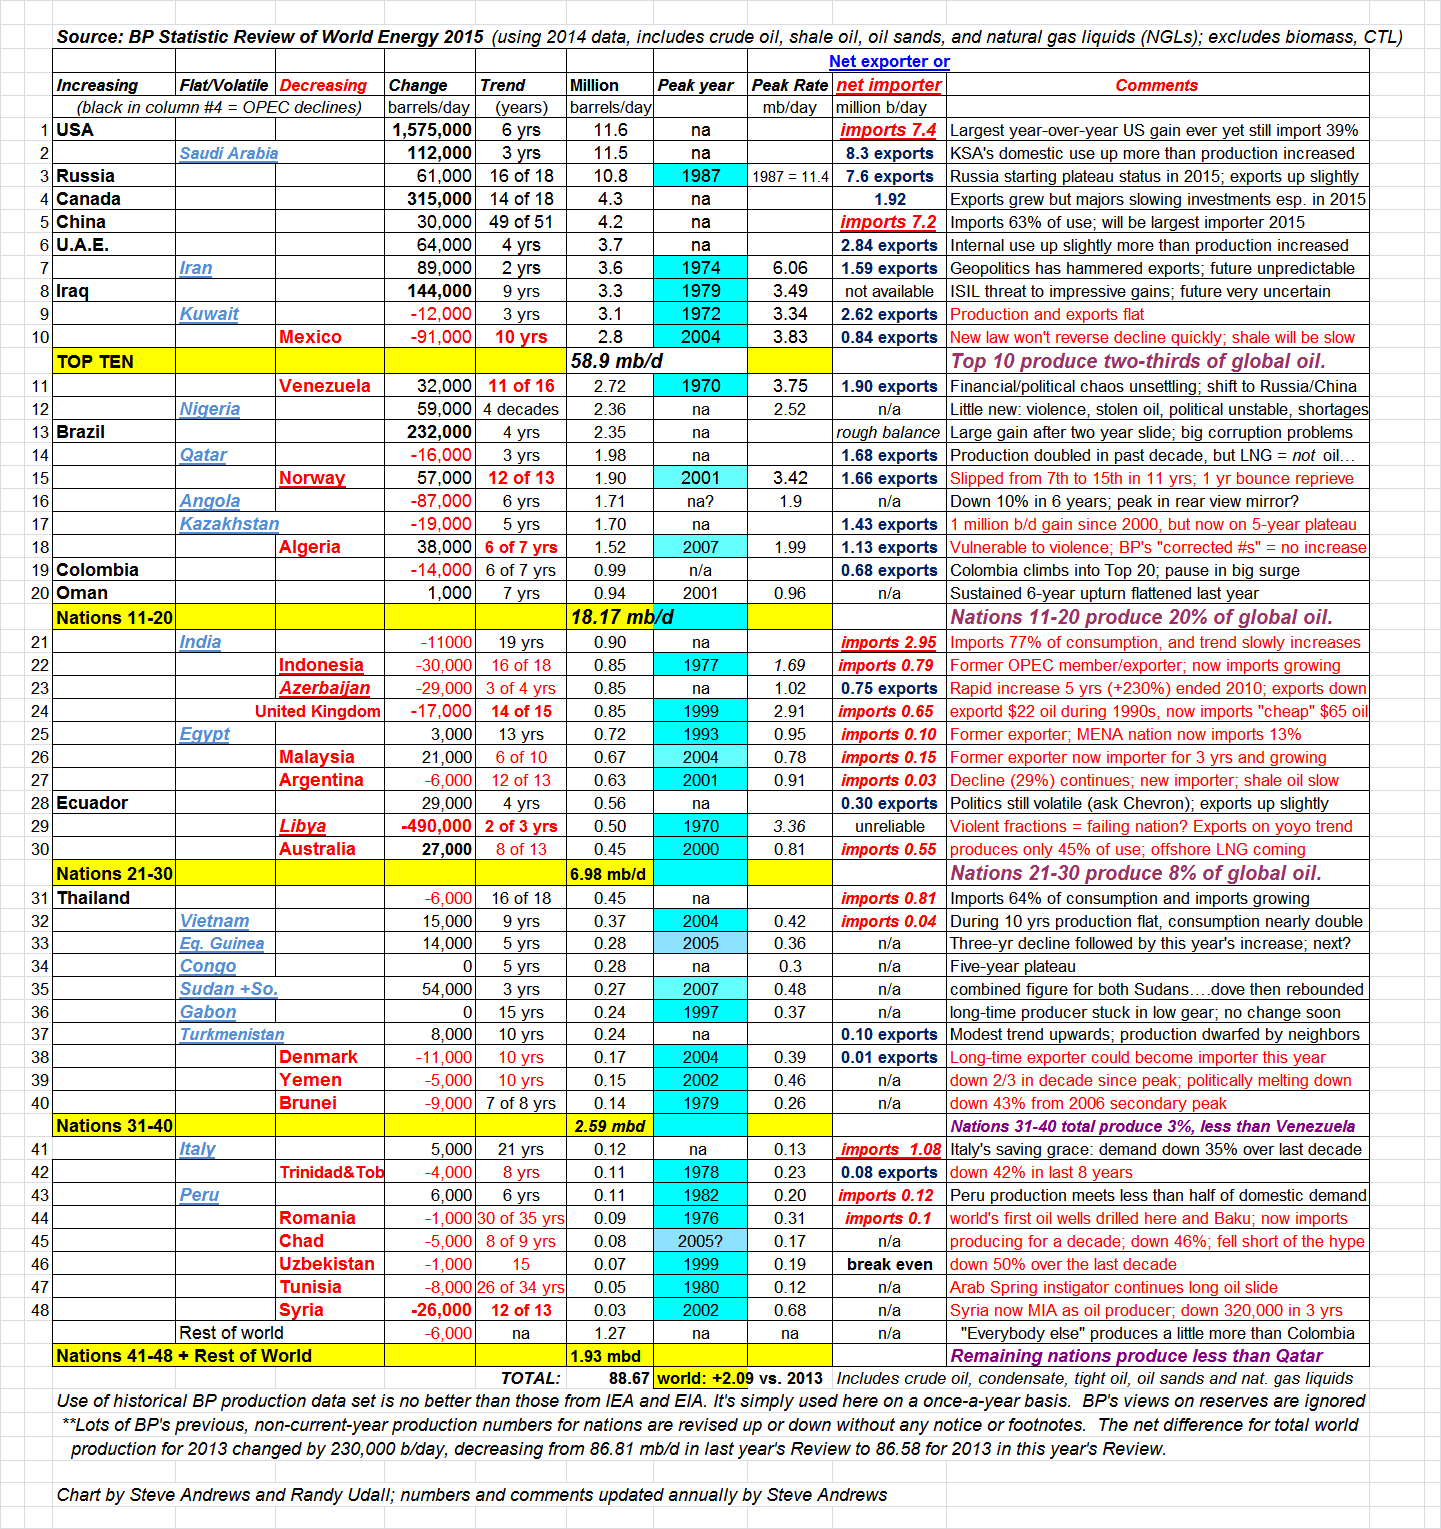
In reviewing BP’s latest Statistic Review of World Energy, the big story for world oil last year was obvious: the USA’s third straight record-breaking increase in average annual production. Just over 75% of the net increase in world oil production during 2014 came from the USA; add in Canada and 90% of the total increase came from North America. Throw in Brazil’s first significant increase in three years and you have all the world’s net gain in world oil production accounted for by three non-OPEC players. Production from all other producers combined was flat. So the question for 2015 is straightforward: will we see a repeat of those gains…and the flat-liners?
The second-biggest oil story from 2014 came at year’s end: the oil price crash. While that event came too late to impact production data for 2014, it is already slowing the USA’s shale oil train and dominating investment decisions–near- and long-term–throughout the non-OPEC oil sector. The early indication is that the history-making growth rates from North America during 2014 will be significantly reduced during 2015. If so, where might 2015 production growth come from?
In pursuing possible answers to that question, here are three additional trends from BP’s Statistical Review of World Energy 2014 to consider going forward:
- Production declines related to violence and political upheaval in Libya, Syria and Yemen totaled 521,000 b/day during 2014 on top of 673,000 b/day drop during 2013, with Libya accounting for most of that decline. How likely is a reversal of that trend during 2015? Might production in adjacent nations be impacted?
- Russia and China, the world’s #2 and #5 producers, together produced nearly 18% of the world’s oil. But recently, their annual gains have been shrinking: BP’s Review shows Russia’s gain during 2014 was 0.6% and China edged up 0.7%.
- Iraq and Iran have the potential to make significant production gains going forward. Iraq increased by 144,000 b/day last year, its 9th consecutive annual increase, and BP shows Iran increased a notable 89,000 b/day after declining a total of 848,000 during the two previous years. What are the odds that production from either or both of those two volatile producers will increase as dramatically as some analysts hope and expect?
The chart below tells a story about: 1) nations that are past peak (see “Peak Year,” turquoise fill) because ot geologic limits (e.g., Norway, the U.K.), or for above-ground reasons; and 2) nations that have yet to clearly peak. It appears that 8 of the top 20 producing nations have seen their all-time highs in production. But in a number of these, production is temporarily increasing, with the USA leading the way.
Adding it all up, peak oil appears close but is not yet here, delayed rather than dead (as widely written in the media since 2012), and disguised by the inclusion of natural gas liquids in BP’s accounting. Apart from the three items discussed above, there are upside possibilities (improved application of technology, new discoveries, a retreat from violence, improved energy efficiency, new policy initiatives, etc.) and downside risks (increased violence, geopolitical twists, financial system disruptions, policies, demand destruction, etc.). Despite all the happy talk about “American energy independence,” our petroleum future includes a peaking in world oil production, and the adjustments that is likely to require. Put this writer down for a likely (80% odds) peak in oil production between now and 2020.
Click on table to view larger in your browser